Performance analytics widgets
These widgets are available on the Dashboard and Analytics boards unless noted otherwise. They use the active filters, and evaluate closed trades when calculating results.
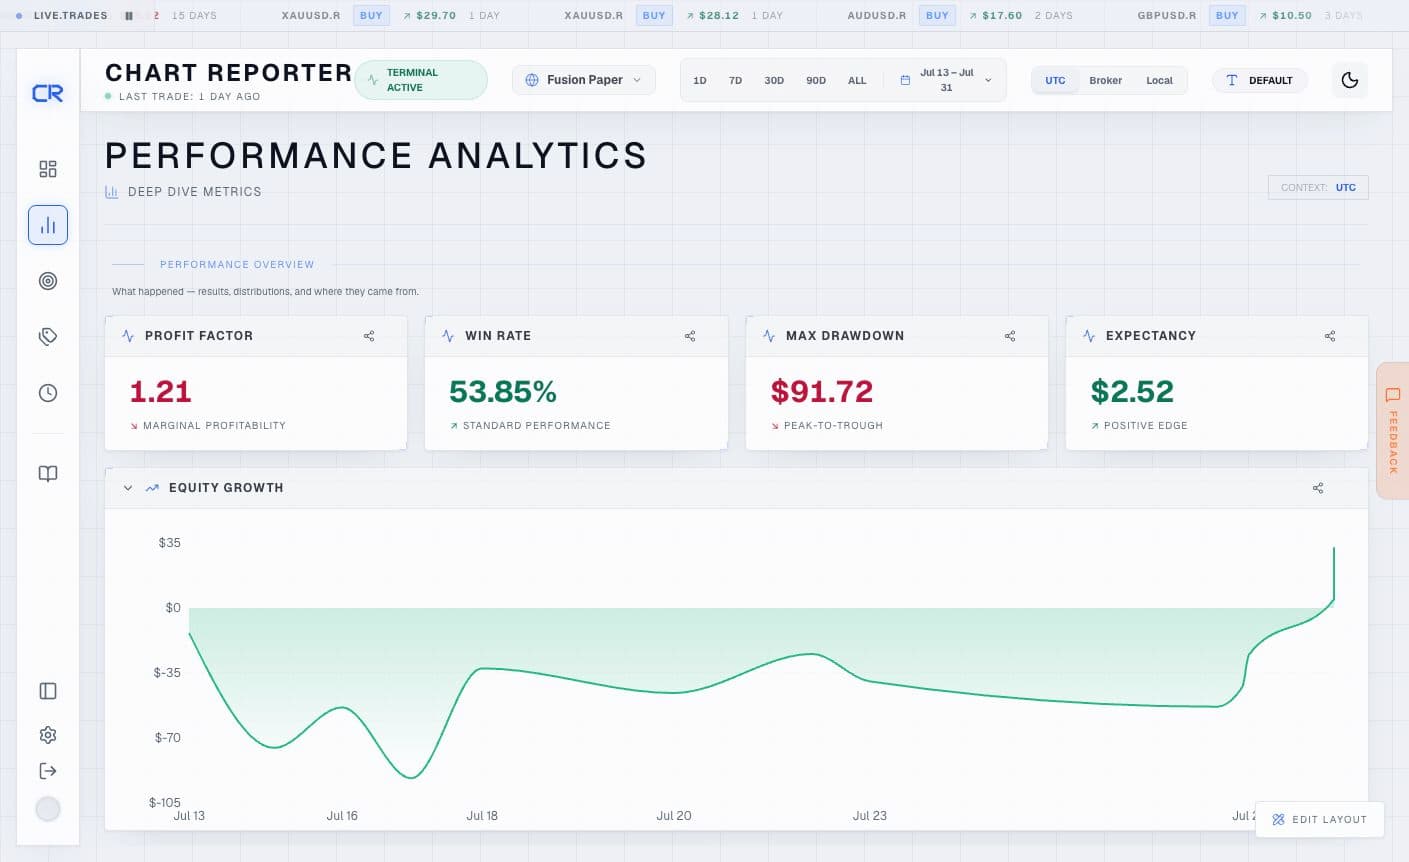
Live widget examples
These are individual live widget examples. Values will change with your selected account and data.
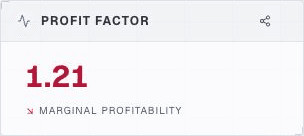
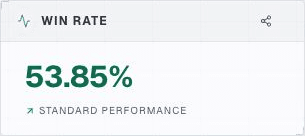
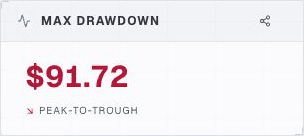
Performance summary
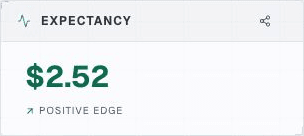
- Metric Card — a configurable single metric such as net P&L, win rate, profit factor, expectancy, drawdown, or trade count. Use several cards for a quick review row.
- Strategic Summary — combines the core performance measures in one high-level panel.
- Live Telemetry — shows the current filter window’s performance metrics, including strategy or session context when selected.
- Information Card — explains the active filter and available data so a result is interpreted in the correct context.
- What's Working / Not — ranks the three strongest and three weakest symbols, strategies, sessions, or tags by net P&L.
- Long vs Short Comparison — compares long and short results across P&L, win rate, profit factor, expectancy, and count.
Use the summary widgets first, then open a comparison or diagnostic widget to understand the reason behind a change.
Equity, distribution, and timing
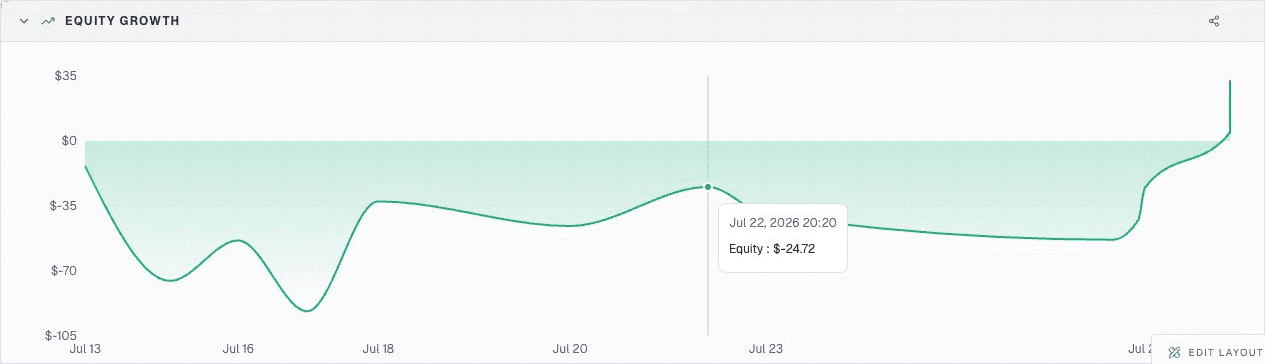
- Equity Growth — plots cumulative net P&L over time. A steadily rising curve with manageable pullbacks is generally more useful than one isolated gain.
- Execution Matrix — calendar view of trading frequency and performance. Use it to find clustered losses, inactive periods, or unusually strong days.
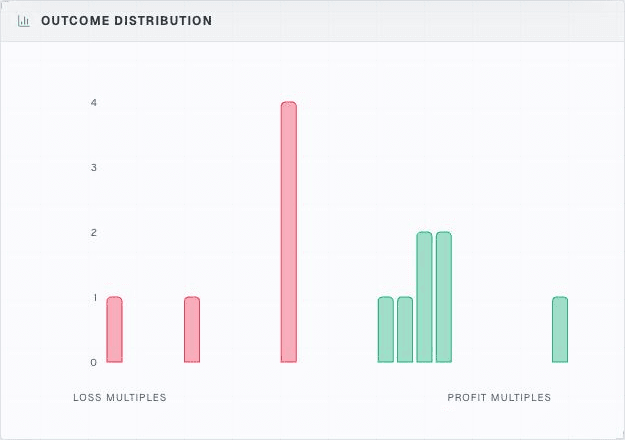
- Outcome Distribution — compares the size and frequency of winning and losing trades.
- Hourly Velocity — groups performance by trading hour. It is useful for testing whether a session window is helping or hurting results.
- Symbol Distribution Treemap — sizes each asset by activity and colours it by win rate or P&L. It highlights concentration before a single symbol dominates risk.
- Tag Cloud — shows tag frequency, win rate, or net P&L. Use it after applying consistent tags to validate setup ideas.
- Execution History — a chronological list of execution outcomes for a quick recent-activity review.
- Streak Tracker — shows current and longest winning or losing runs, plus expectancy after a losing run.
- Rolling Edge — tracks rolling 20-trade expectancy and win rate, and labels the result as improving, stable, or eroding.
Strategy and session comparison
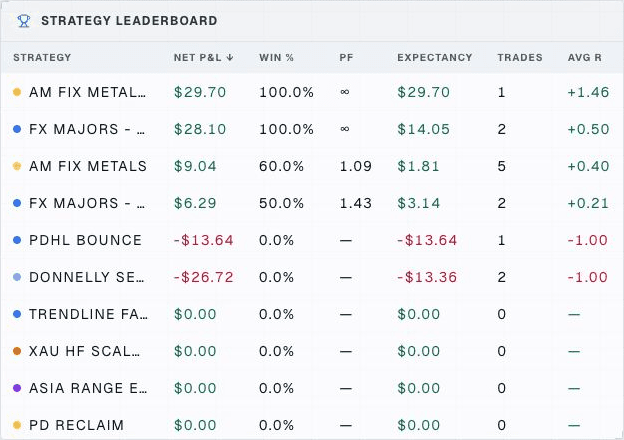
- Strategy Leaderboard — compares strategies side by side; select a row to focus the dashboard on it.
- Strategy Metric Bars — compares strategies using a selectable metric.
- Multi-Strategy Equity — overlays strategy equity curves so their trajectories can be compared without hiding weaker series.
- Algorithm Matrix — manages and selects strategies on the Strategies board.
- Strategy Telemetry — shows detailed metrics for the selected strategy.
- Session Leaderboard — compares named trading sessions and can filter the review to one session.
- Session Metric Card — a compact metric card for a selected trading session.
- Equity Velocity — draws the equity curve for the selected session.
Automatically assign trades to a strategy
Open Algorithm Matrix, create or edit a strategy, and set either matching rule:
- Magic number — enter an exact MT5 magic number, or use
?for one character and*for any sequence of characters. - Entry comment — enter the comment used when the trade is opened. Exact comments and the same
?/*wildcards are supported, which is useful for trades entered through an MT5 MCP that cannot set a magic number.
If a strategy has both rules, a trade is assigned when either one matches. Matching is case-sensitive and applies to the complete magic number or comment. Enable Sync historical matching trades to assign existing journal trades; new trades are assigned automatically when they are imported.
Trade management and R analysis
- Risk/Reward Analytics — compares the planned reward-to-risk with the realised result and related excursions.
- MFE Analytics — reports maximum favourable excursion: the largest unrealised move in your favour before exit.
- MAE Analytics — reports maximum adverse excursion: the largest unrealised move against you before exit.
- R-Multiple Distribution — histogram of planned-risk R outcomes with expectancy and standard error.
- Excursion Quadrant — maps each closed trade by adverse and favourable excursion as a percentage of its planned stop and target. It surfaces near-death winners and targets that may be unrealistic.
- Exit Quality — shows the share of each winner’s best available move that was captured, plus the uncaptured amount in R.
- Stop & Target Diagnostics — tests how close losers came to target and how much stop room winners actually needed; its counterfactuals remain in R rather than implying a guaranteed alternative.
- Stop & Target Hit Rates — groups exits by target, stop, or manual close and gives the average R for each outcome.
- Post-Exit Excursion — measures how far price continued after exit using broker M15 history, expressed in R.
- Best Exit · Time Shift — compares the recorded exit with deterministic +1h, +4h, and +24h exit timings in R.
Behaviour and conditional edge
- Discipline Score — an EA-measured 0–100 composite of stop-loss coverage, stop integrity, position-size consistency, and pacing. It is a review signal, not a judgement of a trader.
- Edge Score — a weighted threshold score based on profit factor, win/loss relationship, drawdown, win rate, recovery, and consistency. Read its formula table before comparing different sample sizes.
- Revenge Trade Detector — compares trades opened within 30 minutes of a loss against the baseline for win rate, expectancy in R, and size escalation.
- Consistency Panel — shows profit concentration, daily P&L variation, green-day rate, and worst-day ratio.
- Conditional Edge Matrix — groups results by EA-captured entry conditions such as RSI, trend, volatility, and moving-average stack.
- Confluence Finder — searches statistically gated pairs of conditions where an edge strengthens or deteriorates. Treat findings as hypotheses until the sample is adequate.
Statistical rigor and risk
- Monte Carlo Simulator — bootstraps the observed R multiples to show drawdown percentiles, losing-streak odds, and a cumulative-R fan chart.
- Luck vs Skill — compares your realised equity curve with 500 seeded reorderings of the same trades to distinguish sequencing luck from the result distribution.
- Risk of Ruin / Kelly — estimates drawdown probability and a Kelly-style optimal fraction from the observed edge. It is an estimate, not a position-sizing instruction.
- Performance Ratios — reports SQN, Sharpe, Sortino, profit factor, and recovery factor with definitions and quality bands.
Formula reference
Profit factor = gross profit ÷ absolute gross loss.
Expectancy = average R across closed trades.
SQN = (mean(R) ÷ standard deviation(R)) × √min(n, 100).
Kelly fraction = (p × R − q) ÷ R, where p is the win probability, q = 1 − p, and R is the average win/loss payoff ratio. Risk and simulation widgets should be read with their sample-size warnings; small samples produce unstable estimates.