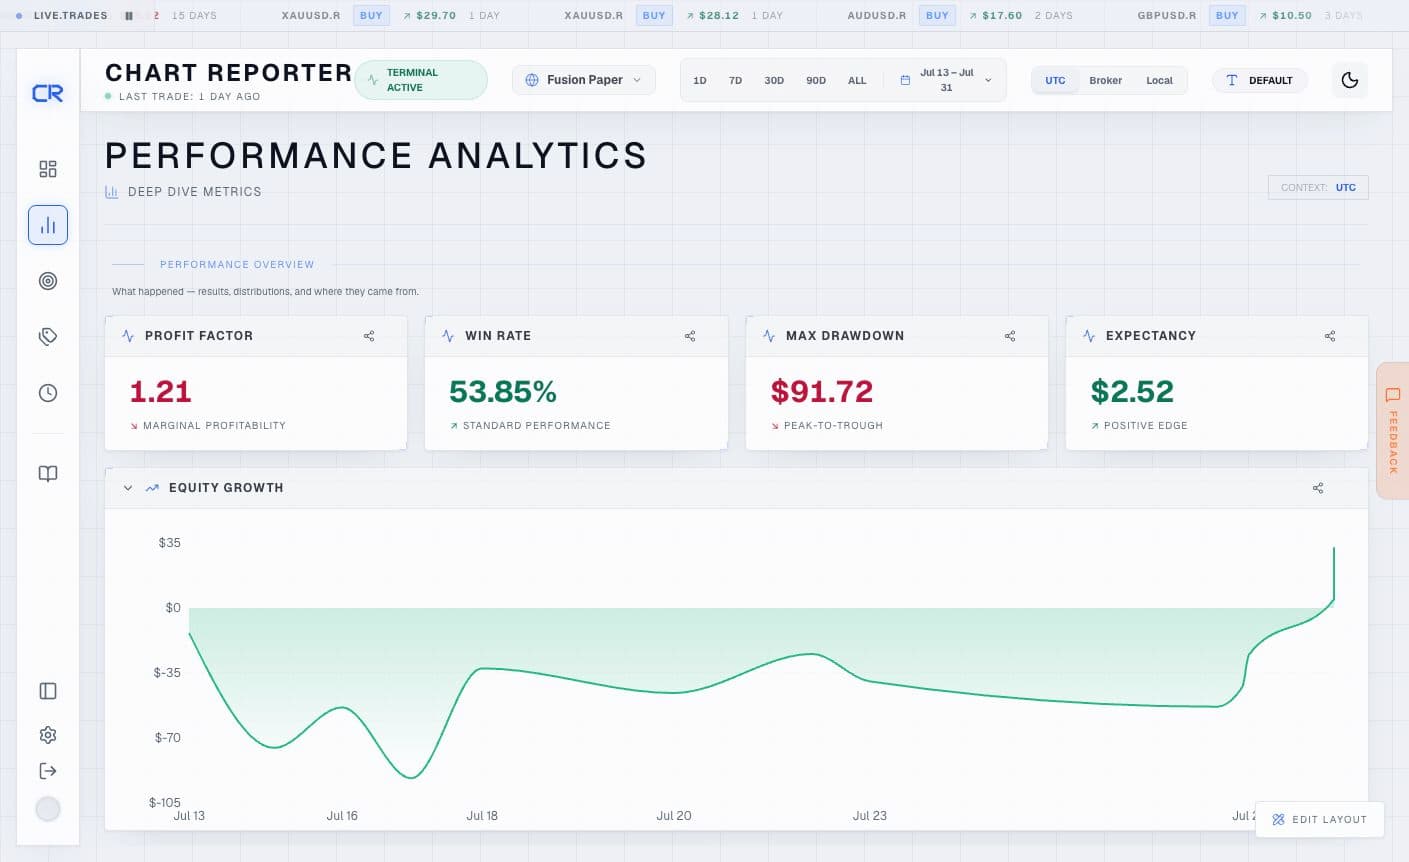
Widget library
Chart Reporter is built from dashboard widgets: focused panels that turn your synced MT5 activity into a chart, metric, review tool, or journal surface. In edit mode, the widget library only offers a widget where it has the context it needs.
Add and arrange widgets
- Open a dashboard, analytics, session, strategy, tag, journal, or trade-detail view.
- Enter Edit layout and choose Add widget.
- Select a widget that is available for that board, then save the layout.
Some widgets are context-specific. For example, Trade Replay only appears on a trade-detail view because it needs a single trade, while Session Trades only appears in a selected trading session.
Metric conventions
- Net P&L =
profit + commission + swap. This is the P&L convention used throughout Chart Reporter. - R multiple =
net P&L ÷ planned monetary risk, where planned risk comes from the EA-captured initial stop. R-based widgets need an initial stop to calculate a meaningful result. - Expectancy is the average trade outcome, usually shown in R when the widget is assessing risk-normalised results.
- Dashboard filters — date, hub, symbol, strategy, tag, session, and timezone — apply to compatible widgets. A widget can deliberately preserve the comparison dimension it is showing, such as all strategies in a strategy-equity overlay.
Browse the library
- Performance analytics — results, risk, behaviour, market conditions, and statistical rigor.
- Trade review — the widgets that explain one specific execution.
- Charts and replay — equity curves and candle replay.
- Journals, sessions, and media — execution records, session control, and screenshots.
The reference describes widgets that are actually offered by the app’s widget library. Legacy widgets retained only to render an existing saved layout are intentionally excluded.
Dashboard example
The Dashboard combines metric cards, equity growth, the live execution feed, drawdown, pattern ranking, streaks, and trader-health widgets in one review surface.